|
An example of the search for order in settlement or other
patterns in the landscape is the use of a technique known as nearest
neighbour analysis. This attempts to measure the distributions according to
whether they are clustered, random or regular. Nearest neighbour analysis may be
used in sand dune vegetation succession studies to test the hypothesis that 'the
stone pine woodland forms the climax community'. Here, tree distribution may be
expected to be random, rather than the regular pattern expected if the trees had
been deliberately planted as part of a sand stabilisation scheme.
The nearest neighbour formula will produce a result between 0
and 2.15, where the following distribution patterns form a continuum:
The formula used is as follows:
Methodology
1. Select an area of woodland using random numbers, and mark out
a 30m X30m (900m²) quadrat.This should be sufficient to obtain a minimum number
of 30 trees (see minimum sample size below).
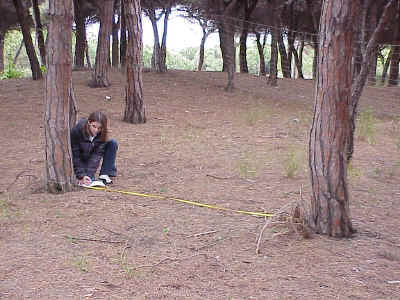
2. Measure the distance of each tree within the quadrat to its
nearest neighbour as illustrated below:
3. Apply the above formula.
Example using a 20 x 20m quadrat with 18 trees:
| Tree No. |
Distance to nearest neighbour (m) |
| 1 |
4.10 |
| 2 |
5.75 |
| 3 |
3.00 |
| 4 |
3.80 |
| 5 |
3.58 |
| 6 |
3.12 |
| 7 |
2.20 |
| 8 |
2.20 |
| 9 |
3.87 |
| 10 |
2.40 |
| 11 |
2.40 |
| 12 |
3.75 |
| 13 |
4.20 |
| 14 |
1.83 |
| 15 |
3.10 |
| 16 |
0.98 |
| 17 |
0.98 |
| 18 |
2.51 |
| Total |
53.77 |
 |
2.99 |
 |
400m² |
 |
1.27 |
This 1.27 Rn value (which becomes 1.32 when reworked with an alternative
nearest neighbour formula provided by David Waugh) shows there is a tendency
towards a regular pattern of tree spacing.
However, with fewer than 30 trees, it is difficult to to say
with any confidence that the distribution has this regular distribution
tendency, and the pattern may have occurred by chance. The Rn value lies within
the yellow shaded area on the diagram below and therefore has a random
distribution at the 95% probability level. The Rn value must lie
outside the shaded area before a particular distribution pattern can be accepted
as significant.
Interpretation of Rn statistic: significant values (after
David Waugh, with thanks)
Assumptions
1. There has been no new natural pine germination since the
planting (if any) of the woodland.
|