|
|
||
|
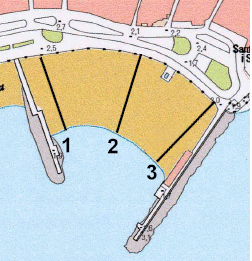
Coastal Processes and Management Investigation: Sitges Background The beaches at the resort of Sitges are losing their sand. The construction of the Aiguadolç marina to the north-east of the town in the late1970s may be one factor in the interruption of the transfer of sediment to the south-west. Hard engineering schemes involving a number of breakwaters and eight rock islets have been constructed to help protect and build beaches between Punta de la Torreta and Punta de les Anquines. However, the loss of sand is continuing, with the recent total loss on some beaches in the Winter storms of 2001. Cliff erosion has undermined buildings and is threatening the main rail route to the south of Spain. There is an urgent need to reconsider the effectiveness of the existing defences and to develop a sustainable coastal management scheme to protect the shoreline and help build and maintain the beaches. Key Questions 1. Why should the coastline at Sitges be managed? 2. How could the coastline at Sitges be managed? 3. How do coastal processes affect the Sitges beaches? 4. How and why do beach characteristics vary along the Sitges coastline? 5. Why are some Sitges beaches more affected by erosion than others? 6. Are the Sitges beaches sustainable? 7. How effective are the coastal management schemes at Sitges? 8. Are the Sitges beaches losing their sand? 9. Has the construction of the Aiguadolç marina interrupted sediment transfer to the Sitges beaches? 10. What are the conflicts involved in the management of the Sitges coastline? Methodology BEACHES 1 and 3 1. For each beach, collect data for 3 beach profiles as shown in the example below:
The width of the beach should be recorded along with changes in slope on DATA CHART 1 2. For each beach, collect one 100 gramme sediment sample from just above the swash zone at each site 1-3. These should ideally be dry and placed in plastic bags, carefully marked and sealed. There should be a total of 3 samples for each beach. These will be sieved later for grain size analysis in the teaching room. 3. For each beach, annotate a map with evidence of:
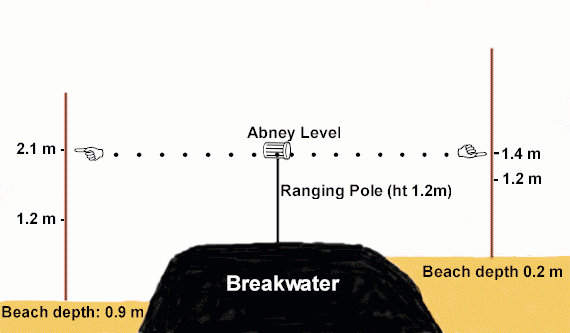
BEACHES 4 - 16 1. For each beach, collect data for 3 beach profiles as shown in (1) above. 2. For each beach, collect 3 sediment sample as shown in (2) above. 3. For each beach, measure the differences in beach height either side of the breakwater. The method is shown below:
Record on DATA CHART 2 3. For each beach, annotate a map with evidence of:
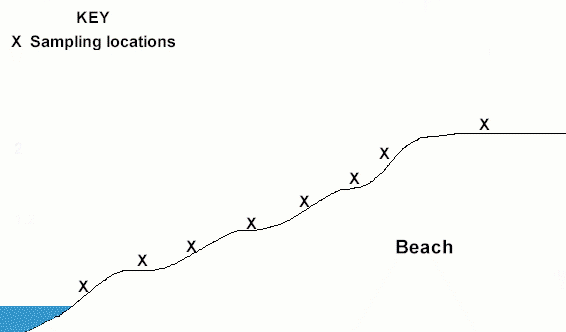
BEACH 18 1. Collect data for 3 beach profiles as shown in the example above for beaches 1 and 3 2. Measure the long axes of 30 pebbles at each change in beach slope (marked X on the diagram below) at profile locations 1 and 3.
Record on DATA CHART 3
3. Annotate a map with evidence of:
SAFETY AT BEACH 18
|