|
|
||
|
Ecostrimed Sampling Procedure
1. Selection of Sample Site The exact location can be moved some metres up or down-stream to assist accessibility.
2. Sampling Procedure (a) Groups should sample in loctic (moving water) and lentic (still-water pools). (b) Area to be sampled should be of identical size: use the ½m² quadrats to identify the sampling zone area. (c) Discharge Flow in m² should be simply measured using the flow meter. There will not be time to measure up the channel cross-section to enable calculation of discharge. (d) Water Water temperature, conductivity, pH and dissolved oxygen should be measured. Great care must be taken not to oxygenate sample of depleted mud or water inadvertently when trying to measure their oxygen levels. (e) Riparian environment The riparian environment should be performed on a 100m stretch of the river (f) Macroinvertebrates should be identified in thefield or brought back in sealed glass jars for identification in the classroom. Loctic Reaches
Steps to follow in order to calculate the index after sampling, sorting and identifying the macroinvertebrates.
1. Starting with input group A, check whether any of the families are present in any of the groups. 2. When you find a family belonging to one of the input groups, select the top or bottom line depending on the number of families found (in groups A, B and C only). 3. Finally, the taxonomic richness (total number of families) in the sample is used to determine the FBILL value.
FBILL index determination table
Lentic Reaches See habit (5) under the BMWP procedure below: Multihabitat sampling: BMWP index 1. Select a river stretch that has not been flooded recently. Samples should be taken in the central areas or at the edges at depths greater than 0.2 m.
2. Divide the river stretch into different areas according to the different substrates present:
It is very important to select a river stretch that has the maximum number of different substrates in order to obtain all the macroinvertebrate biodiversity.
3. Sample once at each habitat following the appropriate methodology. In habitats (1) and (2)
In habitats (3) and (4)
In habitat (5)
In all cases sampling should continue until no new families appear in the successive samples for each habitat. As the sampling is qualitative, a representative sample should be obtained. An exhaustive search for macroinvertebrates is not necessary. Remember that the net should have a mesh of 250 µm and the opening should have a diameter of at least 30 cm. The net should be carefully cleaned between two consecutive sampling stations in order to prevent the presence of animals from the previous sampling.
4. Sorting, identification and counting This stage is performed mostly in the field, with the following steps:
Caution should be taken if the tray is full of litter. In this case the sample should be divided into several parts and each of them carefully examined for macroinvertebrates.
3. Biological quality of the water and the status of the riparian environment If only lotic areas have been sampled, the FBILL index (see above) will be calculated. If all habitats have been included (riffles and pools) together with different kinds of substrates (stones, macrophytes, plant litter, etc.), BMWP’ (see above) should be applied. The field sheet was designed for use with this index. The riparian environment status is an important element for the ecological assessment of Mediterranean rivers. The QBR method has to be used. 4. Ecological status value The ecological status is obtained following the instructions in the ECOSTRIMED index and using the values of the water biological index selected and the QBR index. (see below)
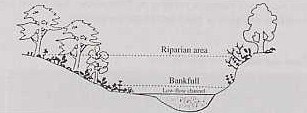
Points to be taken into consideration prior to the use of the index STEPS TO FOLLOW 1 Selection of the observation area The entire potential area of development of the riparian habitat should be considered in order to calculate the QBR index. The main channel and the riparian areas should be differentiated (see the drawing on the field data sheet). Channel: area flooded at least every two years. It is the channel zone up to the bankfull stage. Riparian area: from the bankfull stage until the area flooded at least once every 100 years. Includes fluvial terraces.
2 Each part is analysed independently The QBR is a summation index of four parts. Each part is calculated independently and the individual score of each part cannot be either negative or higher than 25.
3 Calculating each part Each part has 4 main options. Only one of these can be selected, starting with the highest score. The initial score obtained can be modified according to the positive or negative scoring of the conditions indicated below each part. All conditions can be considered (one condition cannot exclude another even when they are of different sign). Select only one of the four main conditions. If the final score is higher than 25 this maximum value should be retained. Negative scores are not possible and in this case a null result will be recorded. Both river banks should be considered as a unit for any condition. 4 Final score The final score is the addition of the four parts, and therefore will vary between 0 and 100. 5 Observations Bridges and roads crossing the river and used to gain access to the sampling point should not be considered to calculate the QBR index. If possible the QBR should be analysed upstream or downstream of these facilities. Other bridges or roads (e.g. those parallel to the river) will always be considered. Avoid the disturbance caused by the facilities providing access to the river, which can result in lower values than expected for all the reaches. Several measures made at the same sampling point are more informative of the riparian status. An evaluation every 100 metres is recommended for detailed studies.
GENERAL RULES 1 Total riparian cover The % cover of all kinds of plants except annuals is measured. Both river banks are considered. The connectivity between the riparian area and the terrestrial forest ecosystem is a very important attribute, and should be considered carefully. The vegetation structure is not considered here (see the following part), only the total cover. The role of vegetation as a key element of the riparian ecosystem is emphasized here. Unasphalted roads or paths less than 4 metres wide are not regarded as elements that threaten connectivity.
2 Cover structure The score depends on the % forest cover; if trees are absent, shrubs and other low lying vegetation are considered. Both banks should be taken into account. Linear arrangements (mostly plantations) or disconnected patches may cause the initial value to drop, while helophytes in the channel or the presence of shrubs below the forest cover increase the score. The main objective of this part is to measure the complexity of the system, which can favour the biodiversity of the riparian habitat both in animals and in plants.
3 Cover quality The geomorphological type of the stream section should first be established. This is done using the field data sheet. The number of species of native riparian trees should be counted and the initial score will depend on this number and the geomorphological type (1 to 3). A tunnel arrangement of trees increases the score, depending on its cover percentage and the gallery-type structure of the vegetation. A gallery is defined in this case as a succession of different species from the bankfull stage to the upper riparian area. A list of the species considered as allochthonous in the study area is provided on the QBR sheet. These species are penalized in the index. To establish the geomorphological type we should use the field data sheet. Using the drawing provided, we will mark the score of the left and right banks according to their shape and slope. The final geomorphological score is the sum of both banks modified negatively by the presence of geomorphological structures that appear in low gradient streams, such as islands, or positively by the presence of hard substrates in which the vegetation cannot root. The final score is used to establish the geomorphological type (from 1 to 3) that should he used in the cover quality evaluation.
4 Naturalness of the river channel Morphological changes occurring in the alluvial terraces, including channel reduction due to agricultural activities, lower the score. The elimination of meanders and river linearization is also considered. Concrete structures along the length of the riparian habitat have a strong negative effect on the score, while a more moderate penalty is imposed if small concrete structures (such as weirs or walls) are present. Bridges and small rights of way or paths used to gain access to the river are not considered.
QBR index: field data sheet. Riparian habitat quality
Score of each part cannot be negative or exceed 25.
* See ** Allochthonous trees in the study area (this should be listed for each study area)
Sampling Material Map with the sampling sites marked. Field sheets (several copies, at least one per sampling site) Field meters: to measure conductivity, solved oxygen (if available). Distilled water to clean the meters. Plastic tape-measure (minimum 10 m). pH and disDepth meter consisting of a long stick with graduated marks each cm. Hand net with a mesh size of 250 mm, at least 25 cm in diameter and ½ m long, to collect macroinvertebrates. White tray measuring approximately 1 5 x 20 x 5 cm, to observe the collected macroinvertebrates. Tweezers. 250 g plastic jars to transport the samples to the lab. Glass jars to collect and preserve animals not identified in the field. Pencil, scissors, waterproof stickers and waterproof pens, to label and mark the samples. Paper labels to attach to the jars. They should be written in pencil and contain the following information: code or name of the sampling site, date, name of the collector, and the tentative taxonomical identification. Rubber gloves. Waders or boots. A towel. Sun protection: hat, sun cream, etc.. |
||||||||||||||||||||||||||||||||||||||||||||||||||||||||||||||||||||||||||||||||||||||||||||||||||||||||||||||||||||||||||||||||||||||||||||||||||||||||||||||||||||||||||||||||||||||||||||||||||||||||||||||||||||||||||||||||||||||||||||||||||||||||||||||||||||||||||