|
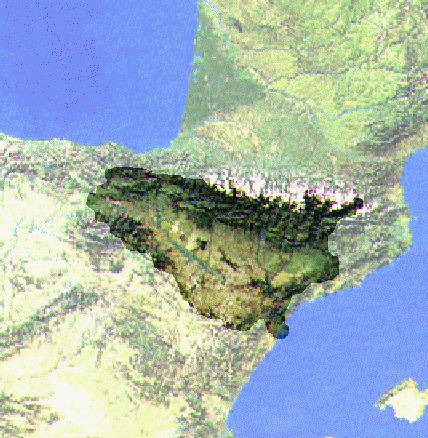
The Ebro River drains a triangular basin with an area of 85.820
Km² in the northern Iberian peninsula, between the Pyrenees and the Iberian
Mountains, with the Cantabrian Mountains as its northern border. The rivers
course is 928 km long.
The river valley receives an average of 18,200 Hm³ of rain and
snow. This precipitation is unequally distributed throughout various areas (it
could be as low as 300 mm per year in the Monegros, to higher than 2,000 mm in
the Pyrenees and Cantabrian Mountains). Precipitation is also quite uneven
throughout the year, with long dry spells in summer and frequent storms in
autumn and spring.
The average discharge registered in the Tortosa gauging
station, located 47.8 km from the river mouth, was 13,408 Hm³ per year from
1960 to 1993 (equivalent to an average flow of 425 m³/s) with a maximum
discharge of 22,450 Hm³ per year (712 m³/s) and a minimum of 4,283 Hm³ per
year (136 m³/s). The irregularity coefficient is 5.2, very much higher than the
irregularity coefficient of 2.92 estimated for a 24 years period before the
construction of the large reservoirs and extension of irrigation areas.
Since the 1930s, 138 reservoirs have been constructed in the
river basin, with a total storage capacity of 6,837 Hm³. This volume is more
than half the average annual discharge and close to a third of the hydric
content received by the river. The largest reservoirs, are the Ebro (450 Hm³)
in the Cantabrian mountains and Mequinenza (1,528 Hm³) and Ribarroja (210
Hm³), close to the mouth, completed in 1962.
These lakes, together with the intensive use of irrigation,
have a significant regulating effect on the river flows. But they also imply a
heavy loss of flow due to evaporation or evapotranspiration. In the 1950s,
the average annual flow of the Ebro in Tortosa was estimated at 614.64 m³/s
(for a period of 24 years), with an irregularity coefficient of 2.92.
That means that in a rainy year the flow can be three times the
flow of a dry year. This average annual flow is equivalent to a total annual
discharge of 19,286.37 Hm3, with is a loss of about 6000 Hm3 per year compared
to the 1960-1983 period.
The river flow shows high variations between the rainy and the
dry seasons. Peak-flows occur in winter (the rainy season in the Cantabrian
mountains) and at the beginning of the summer (snow melt in the Pyrenees). The
minimum stage occurs between July and August (the dry season in the
Mediterranean climate).
The above chart shows the annual flow variability (mean flow in
m3/s) from the Cantabrian (Arroyo gauging station, with cold Atlantic climate)
to the Tortosa gauging station (Mediterranean climate). In the Tortosa gauging
station, the mean flow of March is 695 m3/s while the mean flow of August is
only 178 m3/s. However, in some very dry years (1929, 1949) the flow was only of
32.8 m3/s.. Today, the minimum ecological flow is 100 m³/s in addition to 50
m³/s for the delta irrigation canals.
One of the most important effects of the annual variability are
the important floods that occur mainly during the storm period of autumn, but
also in spring and winter.
|
|
|
Date of flood
|
Maximum
flow |
Water level above river bed in Xerta gauge
|
| November 5, 1617 |
- |
7.68 m |
| October 9,1787 |
- |
10.0 m |
| May 25, 1853 |
- |
8.08 m |
| October 21, 1866 |
- |
7.89 m |
| January 21, 1871 |
- |
6.41 m |
| November 17, 1884 |
- |
7.25 m |
| October 23, 1907 |
23.484 m3/s |
9.20 m |
| May 1921 |
5.500 m3/s |
- |
| October 29, 1937 |
20.000 m3/s |
9.00 m |
| October 1960 |
4.000 m3/s |
|
| January 1961 |
4.400 m3/s |
6.00 m |
|
|
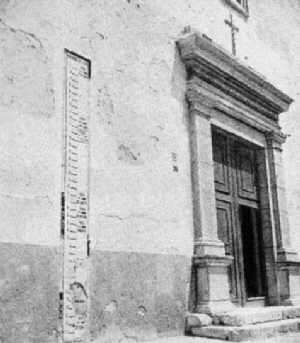
The historical data of floods are difficult to interpret
because they register mainly personal and material damages but do not estimate
flows. However a graphic gauge in the Xerta church (see image) reports the
stage-level of the main floods since the 17th century.
In the 1787 flood, water reached a level of 10.05 m above the
river bed that still is the maximum one ever registered in Tortosa. It follows
the 1907 flood with a level 9.95 m and a peak-flow of 23,484 m3/s (see
hydrograph).
Discharge hydrograph for the flood of October 23 1907 at
Tortosa station
It is nearly impossible to repeat these flows in Tortosa
because of the regulating effect of the reservoirs. The peak-flow in the flood
of November 1962 was only 3,200 m³/s and in January 1977 it was 2,600 m³/s,
when in both cases the precipitation surpassed levels recorded in 1961 and 1937.
|